
As farm machinery costs increase far beyond the rate of inflation, making a new machine pencil out may require some creative thinking about its potential uses and how farm operational expenses will change in the next decade.
Clay Mitchell, farmer and co-founder of farmland venture capital firm Fall Line Capital, says machinery costs have skyrocketed in the last 10-15 years. USDA data show machinery costs steadily rising from about $0.65 per bushel of 150-bushel corn in 2002 to about $1.20 per bushel of corn in 2022 (Figure 1).
Machinery costs increased at more than twice the rate of inflation, and they’ve also increased more persistently than seed, chemical and fertilizer price increases. Mitchell says machinery costs are going up on a per acre and per bushel basis, even though yields have only increased 1.5% per year or less in the same amount of time.
“In other areas of automation, you have this massive decrease in cost per performance, but somehow in farm machinery you don’t,” Mitchell says. “I'm not pointing fingers here, but I see it as an opportunity. Something's gone wrong, and you get less and less for your money every year.”
More for the Money
One way to get more machinery for the money is cheaper machines, but another option is to use machines for multiple applications, including harnessing data in different ways. Mitchell’s farm in northern Wisconsin uses a Case IH Titan 4530 floater to spread crushed rock with a high silica content on fields. The rock is a byproduct of a local mine, and it has enough phosphorus (P) and potassium (K) to replace nearly all commercial fertilizer. It also has a strong liming effect because the rock forms stable bicarbonates when hit with dissolved carbon and water.
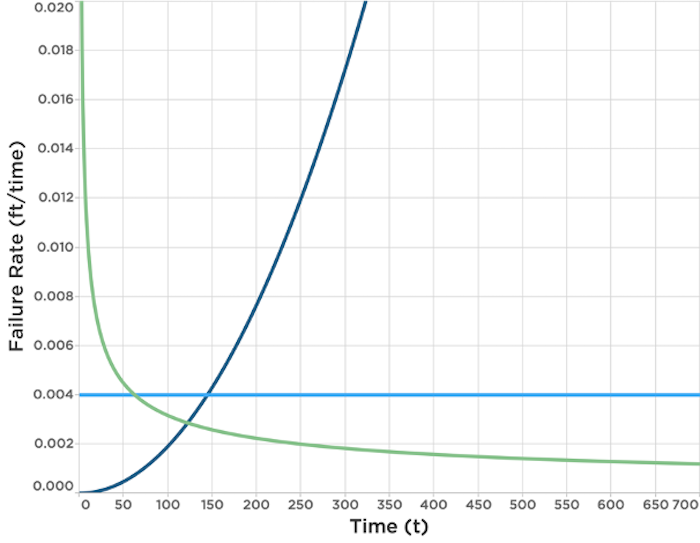
Figure 2. This chart illustrates the Weibull failure rate, which can be used to map a machine’s reliability failures. The green line shows low beta probability distribution that illustrates high initial failure rates, such as the electronics on a brand new combine that didn’t work initially but work as soon as a bad plug is fixed. The dark blue line, referred to as high beta, are the components that wear out, such as cultivator shanks. The light blue line represents random failures. Source: Clay Mitchell
“We're not only replacing lime, P and K, but we’re also generating several hundred dollars per acre in carbon credits,” Mitchell says. “The data is worth hundreds of dollars per acre. We achieve a fundamentally different thing with a machine.”
The farm also uses a roller mounted to the planter to apply mulch film to the rows where the corn is planted. The very thin biodegradable material is 20% of the thickness of the material typically used by horticulture operations. The film creates a greenhouse effect with about a 20-degree temperature increase, and the young corn plants are able to grow through the material. It’s added an extra month to the growing season and more than doubled the yield.
“Be aware that there can be a cost to adding a lot of complexity to machines…”
“We changed from 85-day corn to 114-day corn,” Mitchell says. “We're adding like a month to the growing season. When we were first getting involved at the farm, it was a 108-bushel yield for corn. Now, 250-bushel corn is normal. It's doing something very different with the machinery.”
Analyzing Reliability
Mitchell says there’s an expectation that new and complex machinery is not going to work right away — an unfortunate assumption but one that often proves to be right. One of Mitchell’s employees bought 6 new combines, and only 2 made it across the field.
“We just expect that stuff's not going to work out of the gate,” Mitchell says. “You hope that after a while things get tuned up and they work. But even after that infant mortality, reliability is just not that great.”
With a lot of large irrigation systems on his farms, Mitchell always opts for the 100-year lifespan on the critical components, especially ones that are buried in the ground. As a result, system reliability has become his “obsession,” and he’s adopted a mathematical evaluation to help guide decisions about on-farm investments based on reliability.
 Click to enlarge
Figure 3. This “bathtub” shaped graph plots the expectation of machine failures based on the Weibull failure rate, which is used in reliable engineering to map failures. The X axis illustrates the number of components, and the Y axis is the failure rate. The blue line represents low beta probability — random initial failures, such as a bad plug or electronics that don’t immediately work. The red line is high beta failures, such as a component that wears out over time. Mitchell says he’s concerned that most of his machine failures are low beta issues, which make the entire system unreliable. Source: Clay Mitchell
System reliability consists of components in series and/or components in parallel. In a series, the goal is to improve the reliability of the weakest components. Parallel components are redundant systems where only one component has to work. Farm machinery doesn’t have a lot of redundancy, Mitchell says. If a chopper bearing goes out, there’s no backup. It needs to be fixed in order to start moving again.
“As these machines get more complex, we keep adding things that all have to work,” Mitchell says. “In a parallel system, improving the reliability of the most reliable component has the biggest impact on reliability of the system.”
The Weibull distribution, which maps a broad range of random variables, illustrates a machine’s reliability failures. The green line in Figure 2 shows what is referred to as low beta probability distribution — the high initial failure rates, such as the electronics on a brand new combine that didn’t work initially but work as soon as a bad plug is fixed. The dark blue line, or high beta distribution, are the components that wear out, such as the cultivator shanks. The light blue line represents random failures.
“In a machine, you'll often have a mix of these things,” Mitchell says. “If you put these 3 types of curves together, you get a bathtub shape (Figure 3). The issue we have is when machines are down these days, it's low beta stuff that dominates, and that’s a little scary.”
This concerns Mitchell because when low beta issues arise, components might last for 100 years or 10 seconds.
“I put 2-3 low beta components together, even though they have an expected lifetime of 100 years, they could last 5-10 minutes,” Mitchell says. “But I put the high beta together, and it goes to 98-99 years.”
 Click to enlarge
Figure 4. The graph on the left maps historical price changes for products and services, as reported by the U.S. Bureau of Labor Statistics. Mitchell projected how those trends would play out in the next 10 years in the graph on the right. He predicts skilled repair labor and skilled construction labor will greatly increase in cost, while the price of electronics will significantly decrease. Source: U.S. Bureau of Labor Statistics / Clay Mitchell
Mitchell came up with a mathematical equation to express the relationship between the lifespan ratio of any number of components. He found that adding low beta components makes system reliability quickly crash. This finding then led Mitchell to analyze on-farm investments in the present and future. In the last year, he put up a new storage building, poured concrete and bought electronics, among other things.
“What's my expectation of the return on each of these things?” Mitchell asks. “Lifespan is one thing. The concrete's going to last awhile. The electronics, probably not, but the future replacement cost of these things is really different.”
“It's a fundamentally different thing that we're achieving with a machine…”
Looking at the broader economy, the inflation rate of TVs and computer software have gone down over the last 20 years, while hospital services, college tuition and college textbooks have gone up significantly. Mitchell then projected how those trends would continue in the next 20 years (Figure 4). In his projections, skilled repair and construction labor, steel, electricity and concrete will go up, while electronics will come down.
“For the things where I expect prices to go up, I’m more willing to pay for those things and to make sure that I'm building them reliably,” Mitchell says. “The PVC, steel and things for our irrigation systems have doubled or tripled in price since we've installed a lot of them, so it made it a better investment, and it was good that I put a lot of effort into making them reliable.”
Mitchell encourages no-tillers to think about reliability analytically and look for places to build redundancy. Identify what components are likely to fail in the system.
“Be aware that there can be a cost to adding a lot of complexity to machines,” Mitchell says. “Unless I can operate without the extra feature, is there a limp home feature, or am I adding things that I have to operate for the system to work? If that's the case, then you may need to put extreme efforts into maintenance, repair and engineering, or you may need to simplify and back down, or you may need redundancy. It's worth thinking through and being analytical about.”


Post a comment
Report Abusive Comment