For someone interested in how farmers and agribusiness managers make decisions, the past few decades have been particularly intriguing. As a young faculty member in the 1980s, I was among a group of faculty who successfully lobbied the Dean of the then College of Agriculture to buy Apple II and IBM PC microcomputers to use with students in the classroom. The course instituted at that time continues today, however, the content and the technology have markedly changed. In agriculture our information technology-based tools also have evolved. We’ve become familiar with use of the internet, precision agriculture, Big Data, and digital agriculture. Now Generative AI is the “next big thing”.
A few months ago, I was challenged to speculate as to the likely state of information agriculture in the 2040s. The result of that exercise is summarized in this and two farmdoc daily articles to follow. The second article, Forward Towards the 2040s, is scheduled for next week. The third article, The Confluence of Societal Interests and Precision Ag, is set for the week after Thanksgiving.
Introduction
Over the years, I’ve followed the work of Henry Mintzberg, an esteemed Canadian professor of strategic management. His work had impact primarily because he engaged with managers and studied what they actually did before trying to tell them what they should do. One key Mintzberg observation is that management teams tend to focus time and resources on crafting strategic plans without connecting them to the decisions and actions which got the organization to where it is currently. In contrast, a useful first strategic step is to understand the path that led to today – if you might want to change it.
The title of this article, Past as Prologue, was selected with this important strategic management concept in mind. The word, prologue, refers to events or actions that lead to additional events or actions. Relative to precision agriculture, it is useful to recognize the pattern of events and actions that evolved to where we are today. That recognition should better prepare us to take advantage of the path of change that we’ll enjoy in the future.
The next section of this article will briefly review the pattern of adoption and growth in use of precision technologies since the concept began to emerge way back in the 1990s. The article’s last section will speculate as to insights that could better prepare us for the evolution of technology over the next two decades.
The Prologue for Precision Agriculture Today
A detailed history of the evolution of precision agriculture would require a lengthy thesis. This brief review, however, will rely heavily on the excellent work done by researchers at Purdue University, in conjunction with CropLife Magazine, to document the path of precision technology adoption. A primary feature of their work is a survey that has been conducted at least every other year since 1996 (Erickson and Lowenberg-DeBoer). Its results have provided a unique and extremely valuable benchmark describing the evolution of the use of these technologies. The survey respondents are representatives of agricultural retailers serving farmers, rather than farmers themselves. Because the retailer provides essential products and services to farmers, their perspectives as to the practices of their farmer clientele provide a holistic view of technology use in the community. The results shown here focus on technologies employed in field crop production, with the majority of the respondents located in the Midwest. (Details are available in Erickson and Lowenberg-DeBoer.)
Since 1996, numerous reports of the survey findings have been provided to the agricultural community. A small sampling of those results is shown in the following four figures.
Technologies From Then to Now
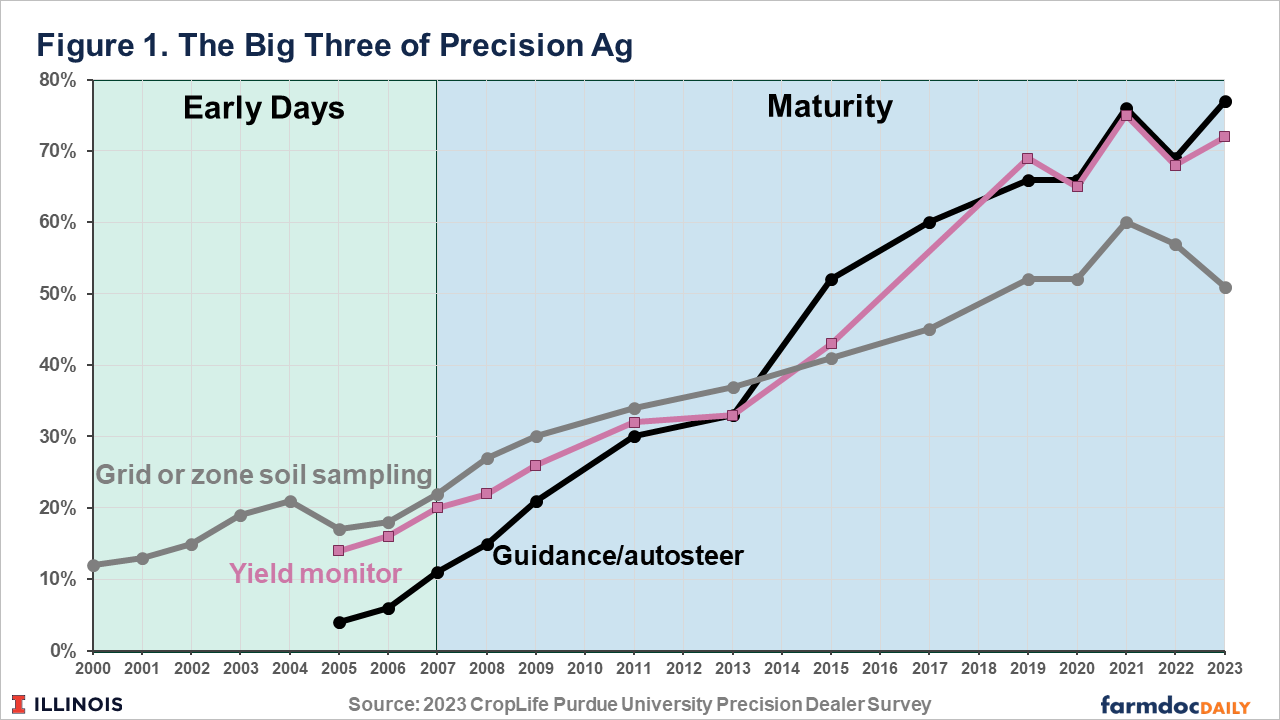
Figure 1 depicts our precision agriculture path over the last two decades. First let’s think about where we were two decades ago. Initial use of three technologies, sometimes referred to as the Big 3 of precision ag, is shown in the green segment of Figure 1. Use of grid/zone soil sampling was a required step for variable rate input application and therefore had the most extensive use (around 20%) in the early 2000s. The use of yield monitors was gaining traction, also approaching 20%. The use of guidance/autosteer capabilities was in an initial stage.
As an aside, my recollection of farmer innovators at that time was that there was a strong consensus that autosteer would never really catch-on as “no farmer will give up control of the steering wheel”. At that time, we didn’t know the path that autosteer use would have. As we look forward to the next couple of decades, we should accept that ideas we hold strongly today may be overwhelmed by future events.
The blue segment of Figure 1 tells the rest of the story, detailing the growth in use of the Big 3 technologies. Their application has shown steady growth, even though financial conditions saw dips and spurts through those years. Yield Monitors and Guidance/Autosteer have clearly become mature technologies. Grid/soil sampling saw similar growth until just a few years ago when a downturn in use was noted.
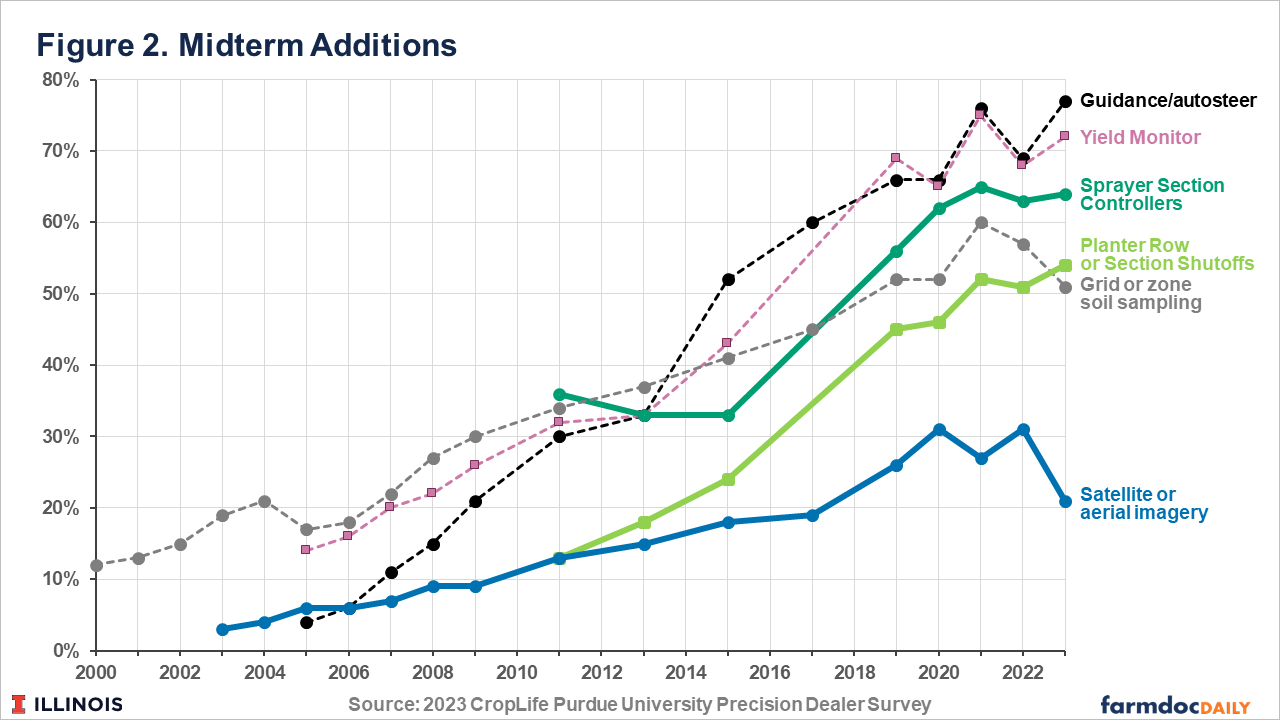
A key feature of precision agriculture to date is that technical capabilities and their application continued to evolve. Figure 2 identifies three applications that emerged somewhat after the Big 3 technologies. Two of the technologies: planter flow/section shutoff and sprayer section controllers, have seen the type of steady growth that the Big 3 experienced after introduction. Use of satellite imagery to monitor crop growth and identify issues during the production season would seem to have value. However, its application has seen less growth and even decline recently. This will be discussed further in the following paragraphs.
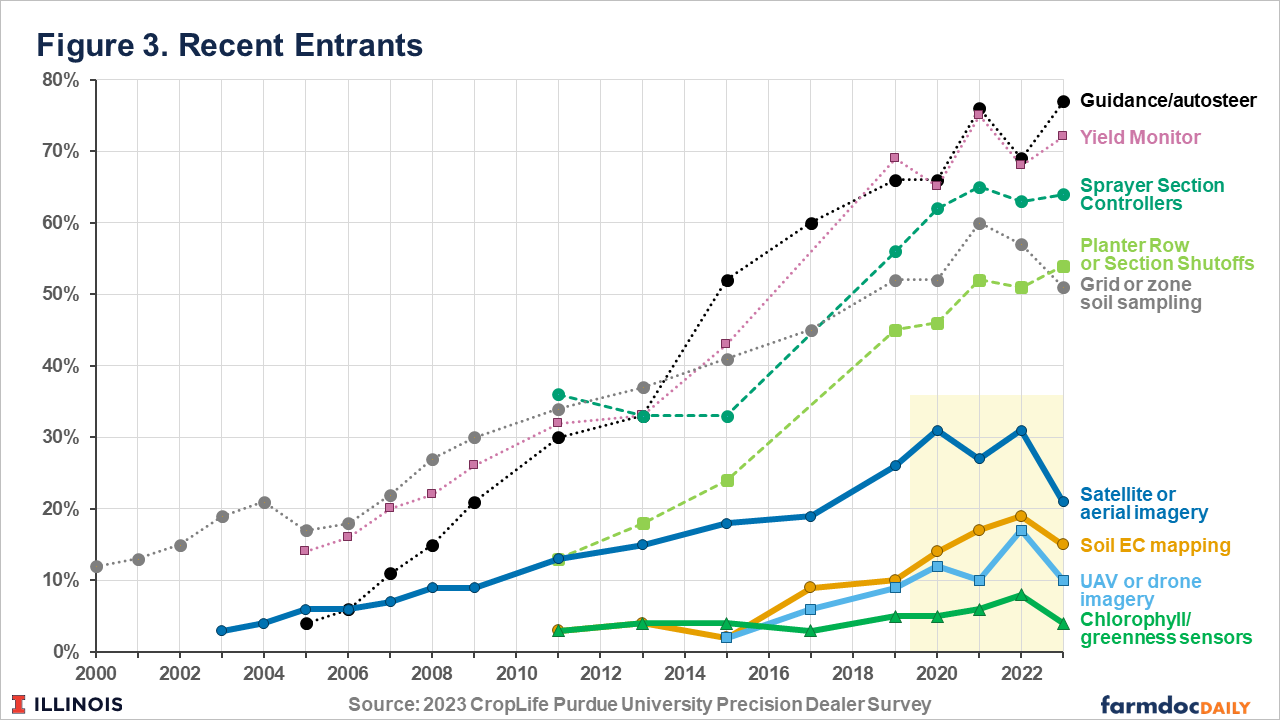
Figure 3 adds three applications as recent entrants to the precision agriculture portfolio. These are soil EC mapping, UAV/drone imagery, and chlorophyll/greenness sensors. As recent entrants, none have yet reached the market penetration seen by the applications that preceded them (highlighted by the yellow segment in the figure’s lower right corner). At this point, each is striving to breakthrough the 20% level. That is consistent with the pattern of adoption seen for other technologies.
The UAV/drone imagery category is interesting when considered in combination with the satellite/aerial imagery category discussed previously. In the last few years, the combined use of these applications approached 40%. This suggests that remote sensing as a broad category has growing appeal, with the role of specific approaches yet to be determined.
From Shiny Toys to Data
Early in the precision ag era, farmers, managers and academics were naturally fascinated with the “shiny new tools” that were becoming available. Developments such as GPS, the internet, and autosteer would allow farmers to do things never before possible. Imagine, a farmer could see their crop yields as they drove across the field harvesting that crop. And they could then get a geo-referenced report detailing those results. This was fun to consider.
Over the last two decades, advances in technical capabilities have continued to produce new toys. However, increasingly the agricultural community is recognizing that just using the tools doesn’t optimize value. As a result, greater emphasis is being directed to enhancing productivity and profits through use of the output these tools provide. That output is data.
Data is not shiny, and for most of us, it is not fun. But, in commerce it is a key driver of value creation. In their 2023 Precision Agriculture Dealership Survey, Erickson and Lowenberg-DeBoer stress the marked increase in the use of pooled data from customer farms to support farmer decision making. (Pooled data is that which has been aggregated from multiple farms.)
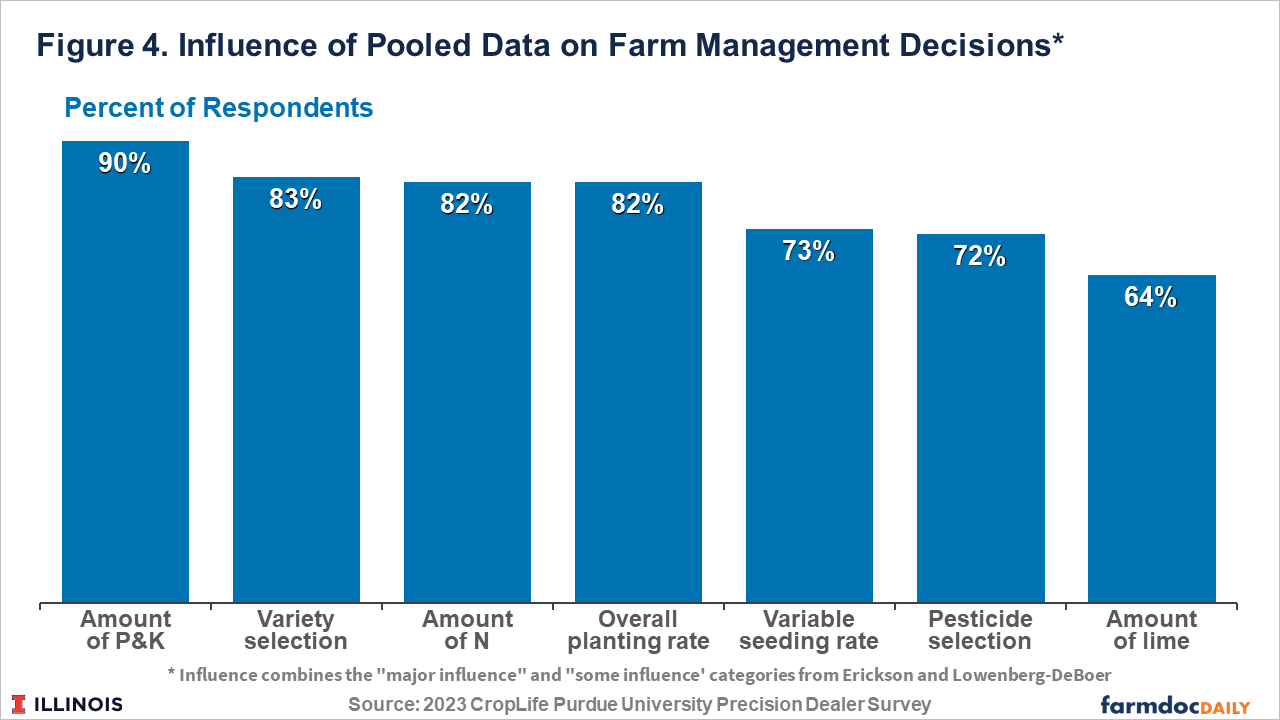
Figure 4 illustrates the current influence of pooled data for seven key agricultural decisions. The values in Figure 4 combine the survey responses of those who report major influence and those who report some influence. Clearly, pooled data has influence on fertilizer decisions, with 90% and 82% responses for phosphorous/potassium and nitrogen, respectively. Across each of the categories listed, use of pooled data is influential. In contrast, a half-dozen years ago, only slightly more than 10% of the respondents reported that data had a major influence on P and K decision making (Erickson and Lowenberg-DeBoer). And that was the highest level reported for any of the decision categories in Figure 4.
Wrapping Up
Over the last three decades, we’ve seen considerable evolution in the extent of use and the tools employed in what we call precision agriculture. The preceding discussion has highlighted some of those developments. While interesting, the purpose of reviewing this experience is to suggest insights for the future.
Below are thoughts in that regard:
- The adoption pattern and timeframe are relatively consistent with adoption of similar technologies in the non-ag world. Recently we’ve become accustomed to much more rapid adoption and obsolescence cycles in consumer electronics and software. However, innovation requiring novel practices in the commercial world occurs at a different pace. For field crop agriculture, the “one cycle per year” reality significantly affects the pace of technical change. Therefore, the future innovation path for precision ag technologies is likely to follow the steady “learn as we go path” experienced over the last few decades.
- The technology applications that farmers considered in the 2000’s were quite limited relative to those available in the 2020s. Figures 1, 2, and 3 document that proliferation. What’s not shown here is that the performance of each technology also was enhanced over those years. The 2024 yield monitor is considerably different than that available in 2004. And the 2044 yield monitor may well differ from today’s.
- I believe that recognition of the growing influence of the farmer’s own data, pooled with that of others, is an important recent development. Previously not being an early adopter of yield monitors probably didn’t put an individual farmer at a significant competitive advantage. However, the process of improving decision making through the use of internal and pooled data is likely to require a considerable learning curve. Being late in starting that learning process may be more difficult to overcome.
A few years ago, I was chatting with an Illinois farmer about how he used precision technologies, such as yield monitors and autosteer. After a few minutes, he looked at me and asked, “How else would you farm?” Maybe, in the 2040’s, the conversation will focus on data; how to acquire and analyze it. Will the question again be, “How else would you farm?”
Next week’s article in the series will identify a set of technologies that are becoming commercially available or are in advanced stages of development. They have the potential to fail. Also, they have the potential over the next couple of decades to become mature technologies, as commonly used as yield monitors and autosteer are today.
References
Erickson, B. and J. Lowenberg-Deboer. “Precision Agriculture Dealership Survey.” Departments of Agronomy and Agricultural Economics, Purdue University, West Lafayette. Indiana. December 2023. https://ag.purdue.edu/idaas/_media/croplife-purdue-precision-dealer-report-2023.pdf


![[Technology Corner] Helping Your Customers Determine Which Technology is Right for Them](https://www.precisionfarmingdealer.com/ext/resources/2025/03/26/Helping-Your-Customers-Determine-Which-Technology-is-Right-for-Them.png?height=290&t=1743084621&width=400)


